Kabir Kutty

Kabir Kutty

Hi! My name is Kabir. I'm a teen developer, behavioral science enthusiast, author, and composer, and these are a few projects I’ve been working on (maybe too much!). CHECK OUT SOME OF MY KAZWIRE SIMULATIONS BELOW! :) Here is my LinkedIn: https://www.linkedin.com/in/kabirkutty/

Engineering + design Performance + iteration Reliability mindset
LoopLess Logo

LoopLess

Student-founded productivity startup • iOS + behavioral science
CBT & habit loops iOS UX Coaching flow

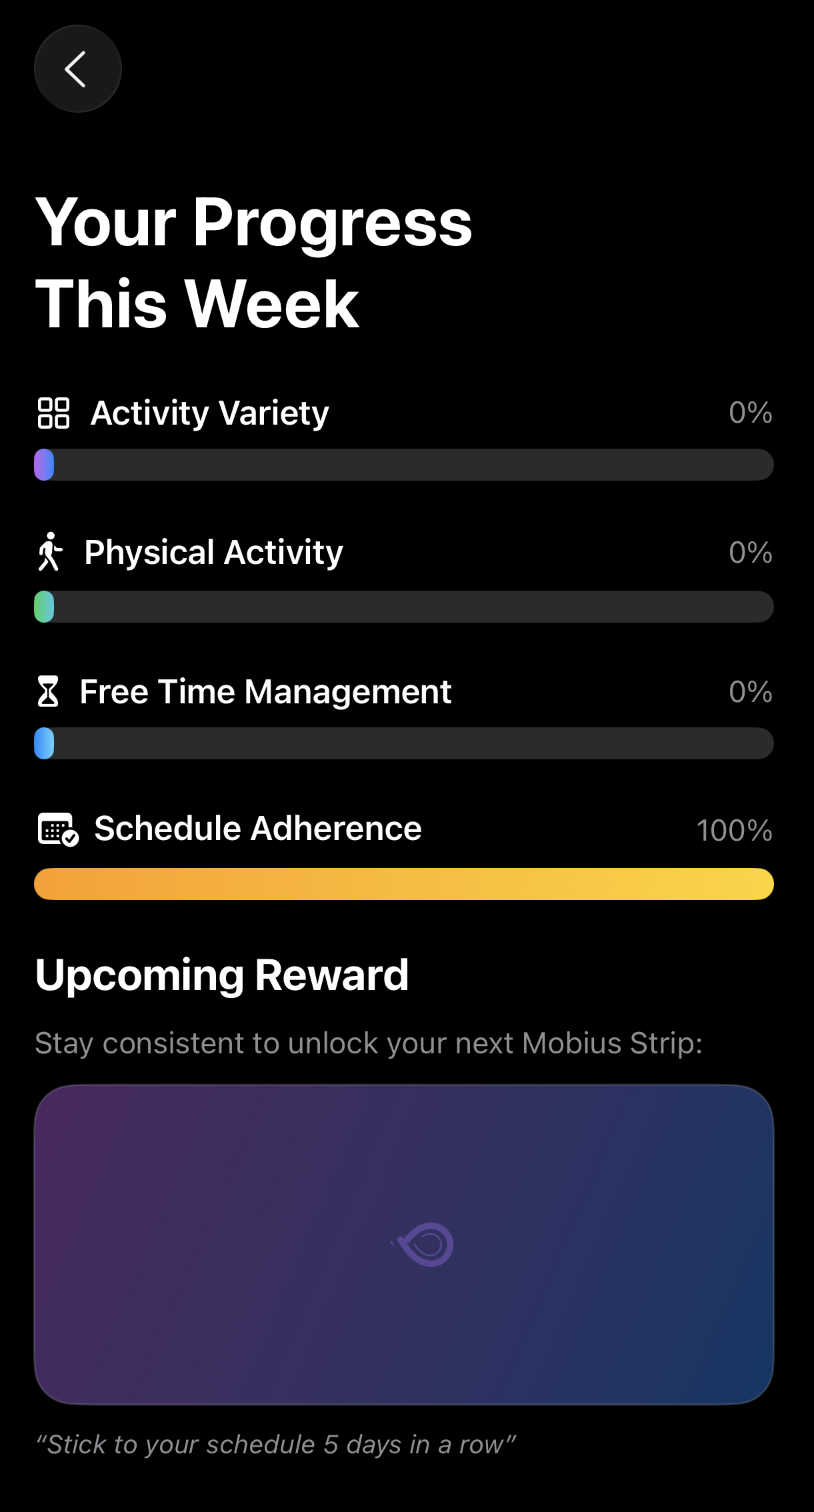
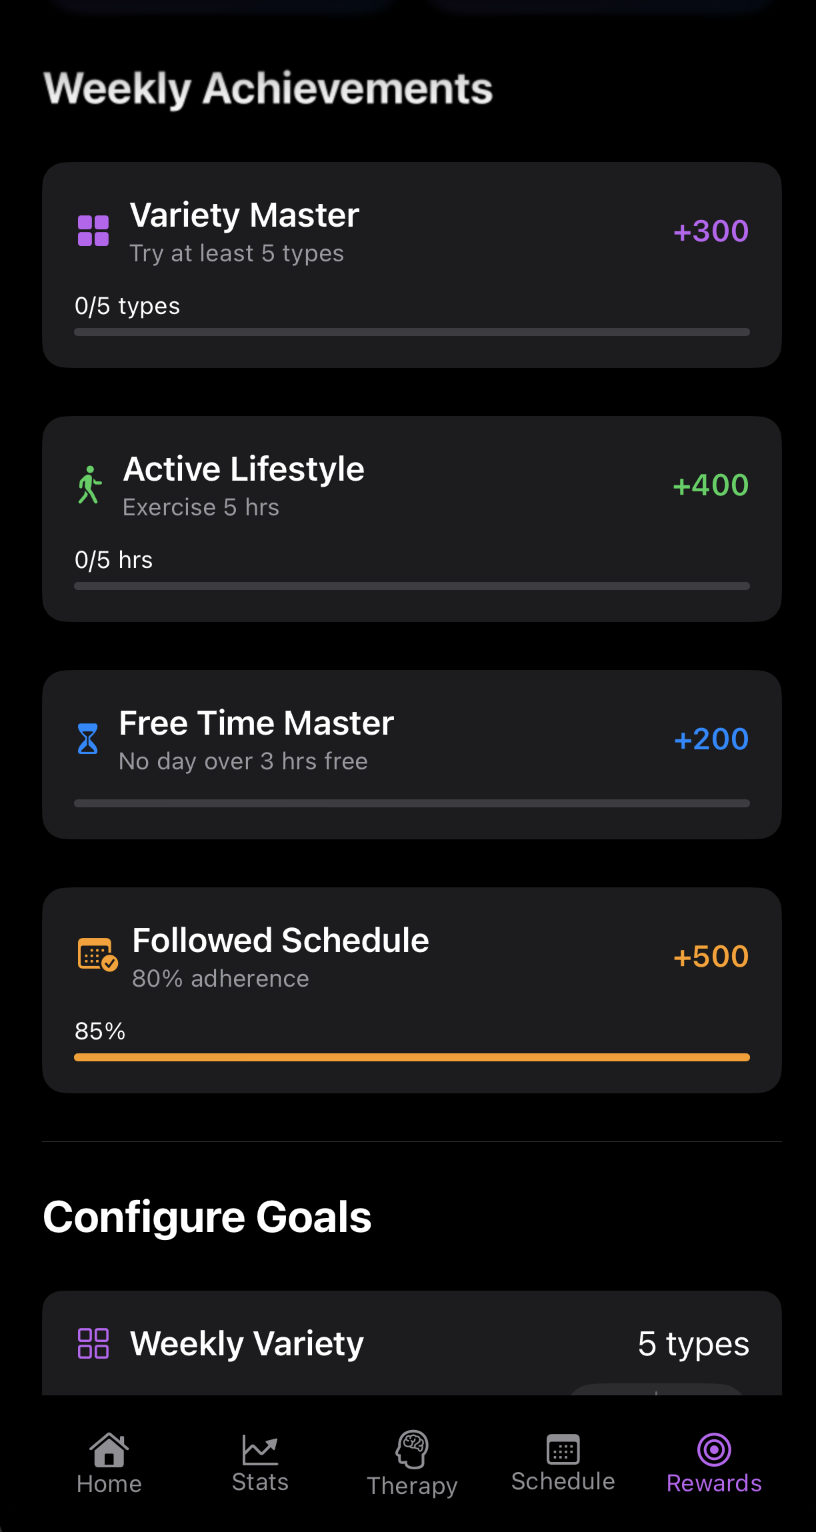
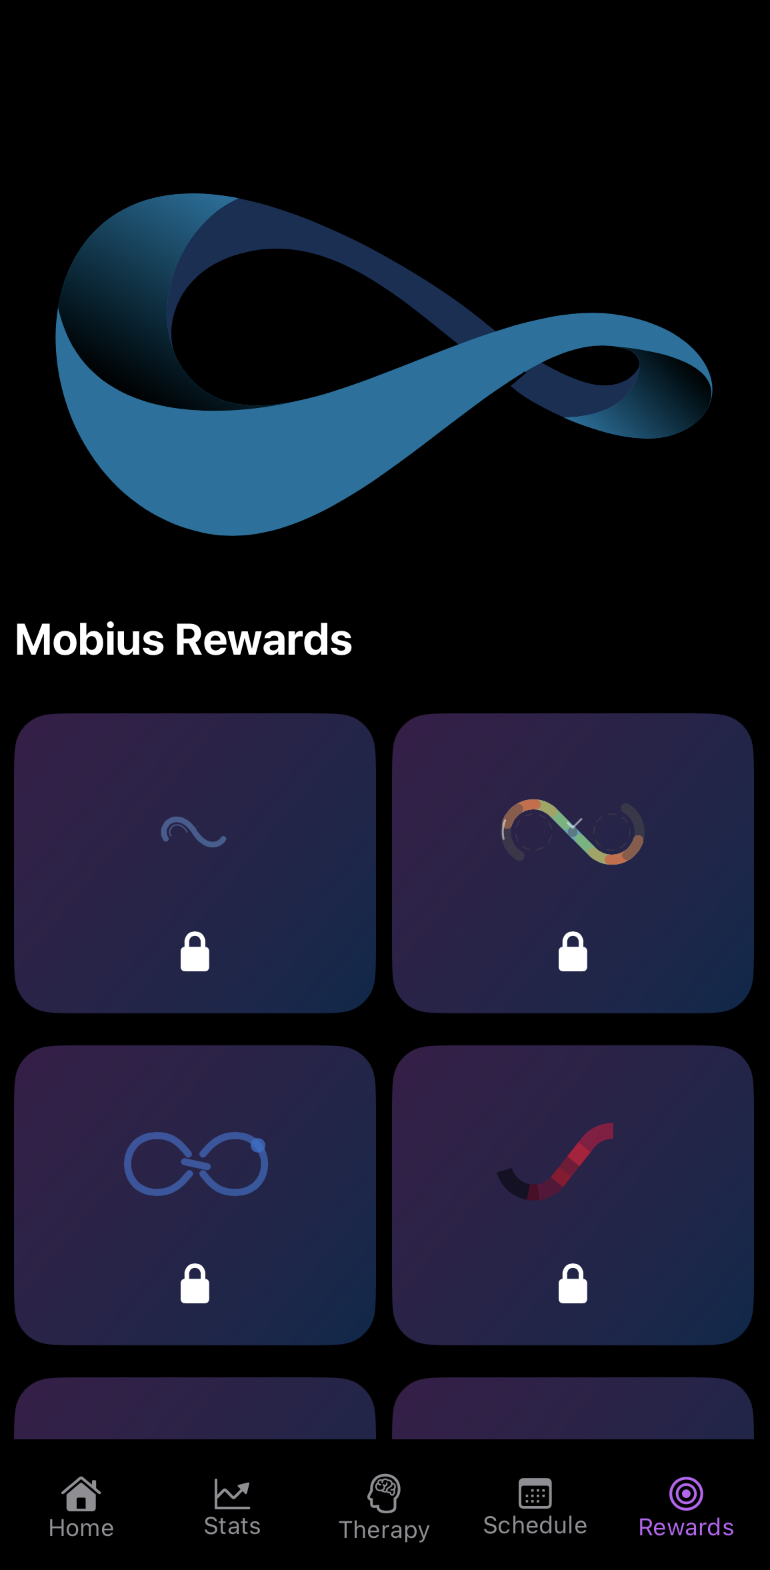
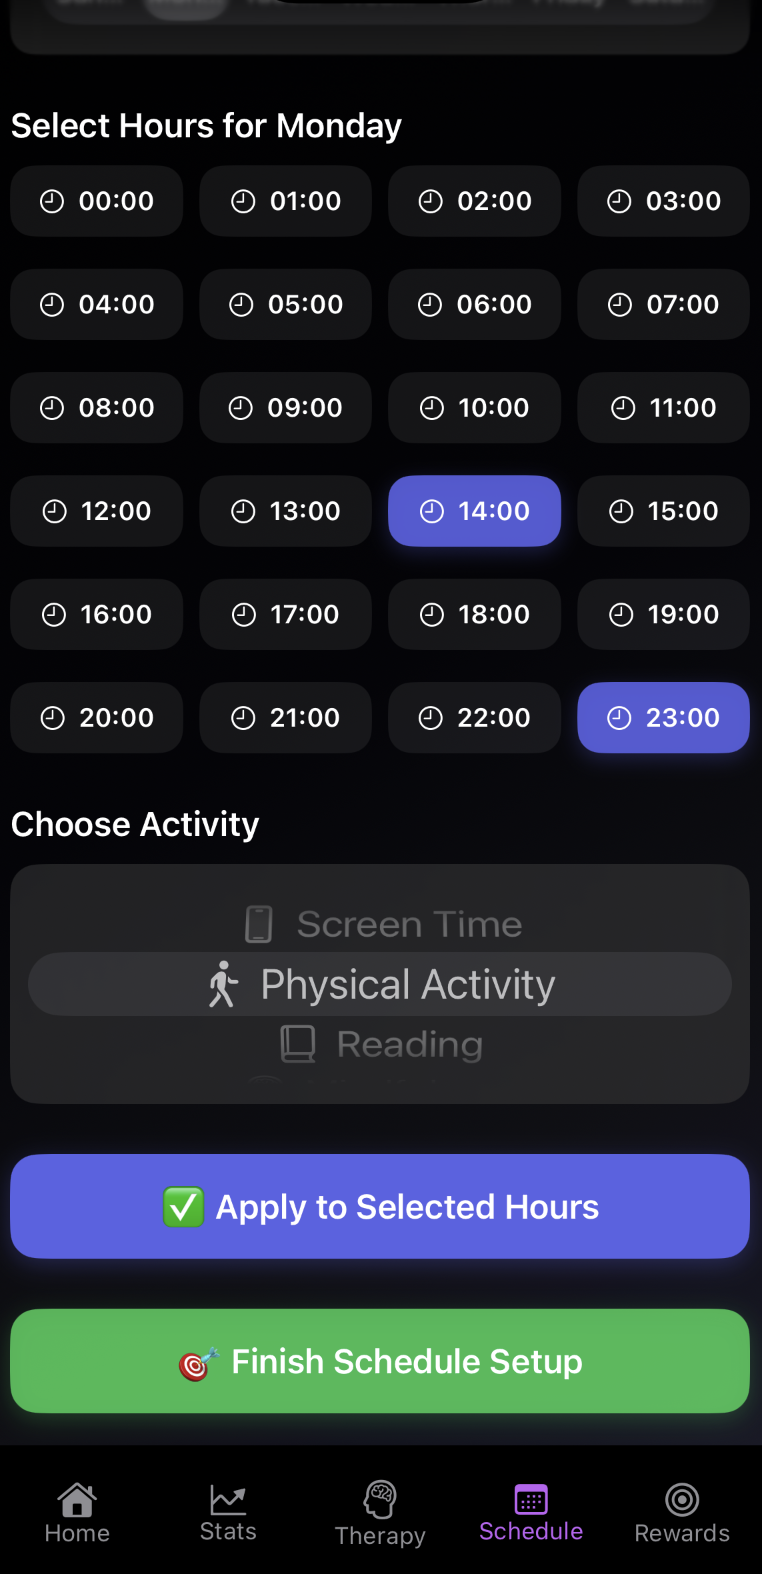
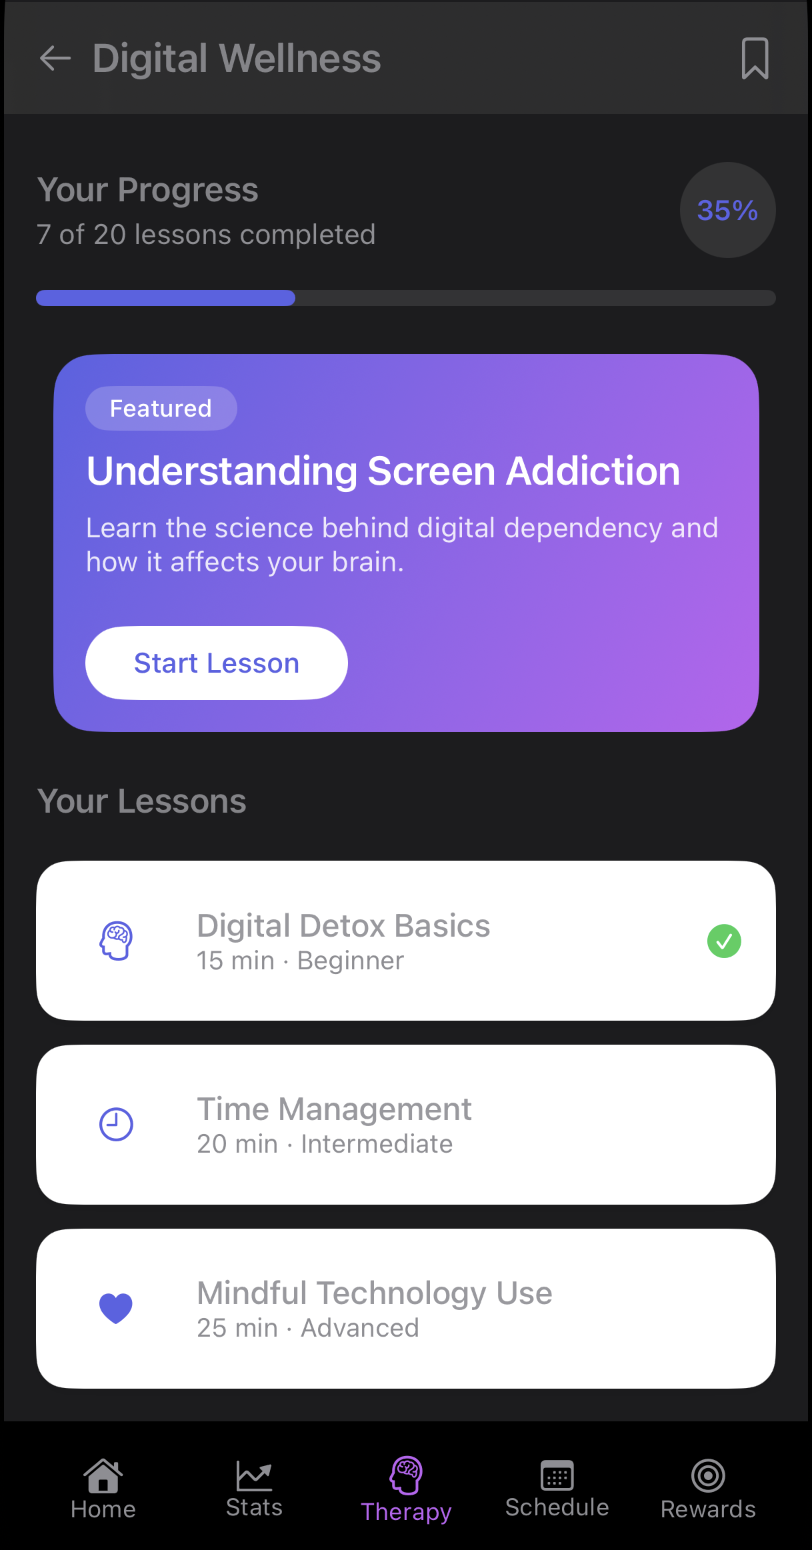
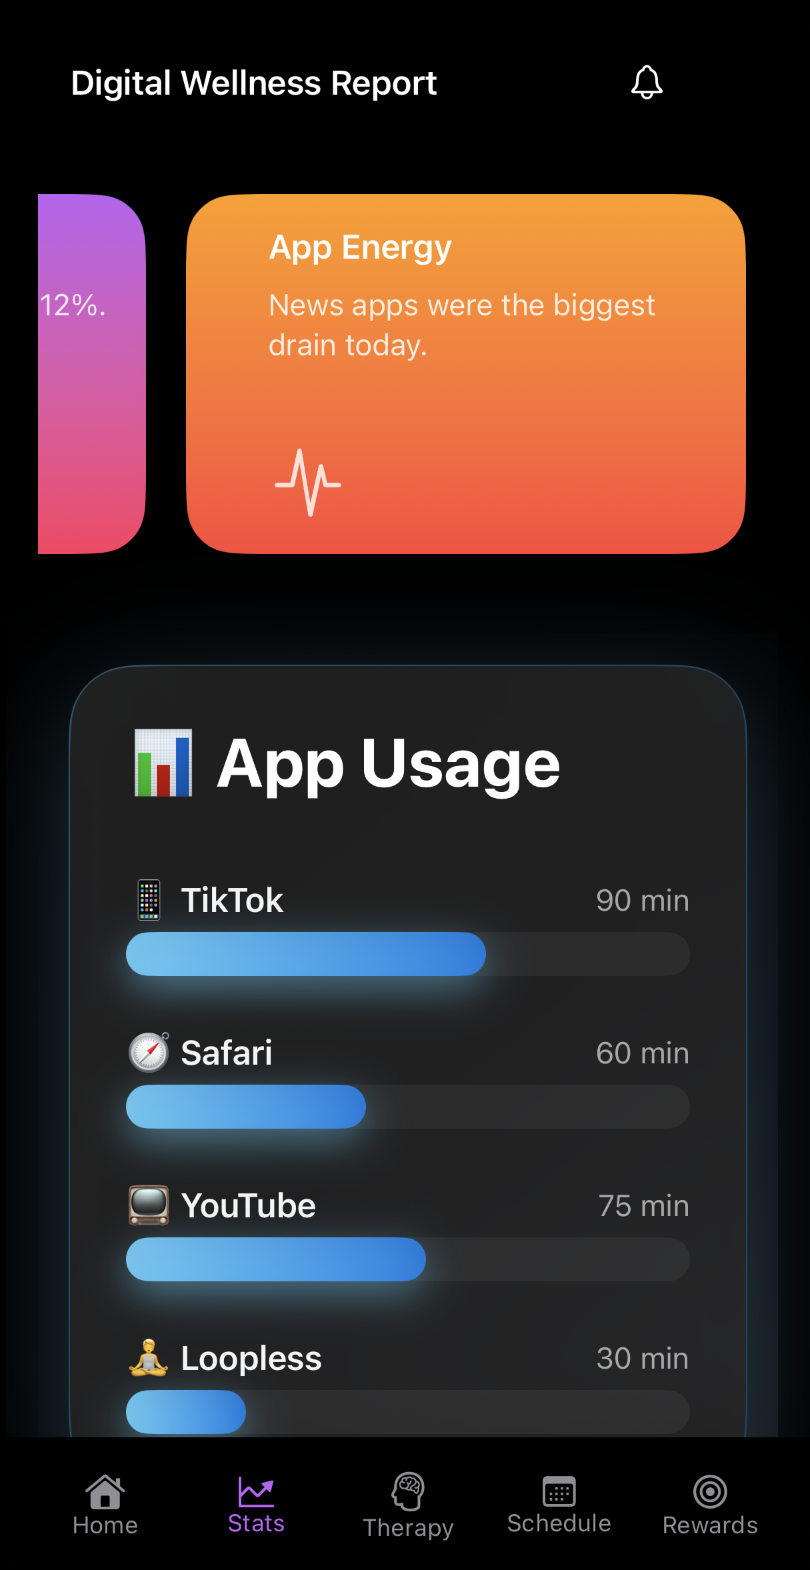
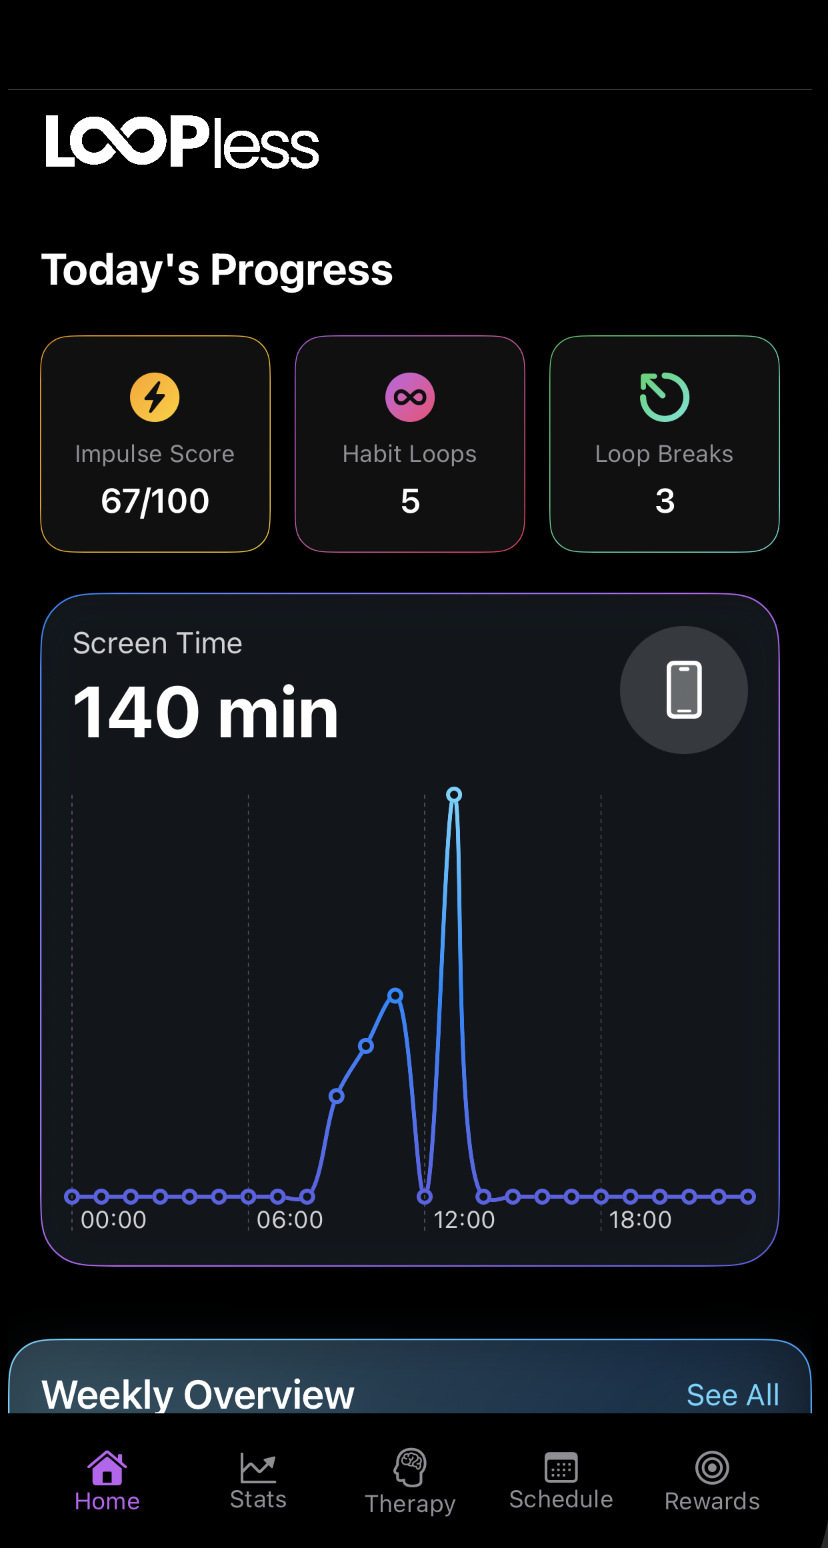
LoopLess is a student-founded productivity startup on a mission to help people break the endless scroll and live with intent. I built an iOS app that blends CBT concepts, mindfulness science, and structured reflection into a focused, modern experience, a personal “focus trainer” that nudges you toward healthier digital routines.

Kazwire Logo

Kazwire

Infrastructure & performance • Keeping production boring (on purpose)
p95/p99 focus monitoring & alerting safe deploys
15k Monthly Users
real load patterns
$30K Revenue
real stakes
4 on Payroll
team ops
7K Discord
feedback loop
Social Spikes
burst traffic

What I actually do on Kazwire

I work on Kazwire’s infrastructure and performance. Most of my time is spent keeping the site fast and stable as traffic grows, setting up monitoring, understanding latency issues, and making backend/deployment changes so updates don’t break things. I also built analytics dashboards so we can see what’s actually happening on the site and make decisions based on usage. It’s been a mix of practical engineering and problem-solving, teaching me a lot about reliability and iteration.

Latency
p95/p99, hot routes, payload size, edge caching, compression.
Observability
structured logs, metrics, dashboards, correlation IDs, error budget thinking.
Reliability
health checks, graceful degradation, “fail closed” defaults, abuse controls.
Deploy safety
container builds, staged rollouts, quick rollbacks, config hygiene.
Docker Svelte TypeScript Node.js PostgreSQL
Hover: what I track
I bias toward stuff that tells the truth under load: request timing distributions (not averages), cache hit %, error rate, DB saturation, and deployment correlation. If a metric can’t answer “what changed?” it’s decorative.
tail latency cache behavior query plans deploy diffs abuse surface
kazwire-prod // live incident drill
# Click “Run drill” to simulate a realistic sequence of checks.
# Everything below is UI-only and stays on this page.
Tuning: traffic + caching
Traffic intensity
moderate
baseline concurrency
Cache aggressiveness
balanced
swr tuned
Status: stable

Through Kazwire, I’ve grown more aware about what distinguishes a site that works from a site that keeps working. The work is incredibly fun, but ultimately, it serves to elevate user experience in a subtler way than they may first notice (that’s where the nitty gritty comes in: cache hit ratios, tail latency, noisy alerts, etc.). I enjoy keeping the site working and serving users through principles of behavioral health and just fundamental UX.

Performance hardening

Budgets for bundles and responses, compress aggressively (Brotli/gzip), and keep the slow paths isolated.

Infra hygiene

Containers that build cleanly (multi-stage), consistent env config, and predictable boot behavior.

DB sanity

Index the real access patterns, watch query plans, and avoid “surprise” sequential scans under load.

Abuse + safety

Rate limiting, validation, and guardrails so a weird traffic spike doesn’t become a system-wide fire.

Deploys you can trust

Staged rollouts, health checks, rollback paths, and changes sized small enough to reason about quickly.

Dashboards that answer

Where’s it slow? Where’s it failing? What changed? If the dashboard can’t answer that, it’s decoration.

Reliability surface area (how I mentally model it)
This is the rough “map” I use when something feels off, enabling me to narrow down possibilities.
Surface What I look for Fast check
Edge / CDN hit rate drops, cache stampede, headers drifting cache-hit%, TTL, swr
Backend timeouts, queueing, tail spikes p95/p99 by route
Database plan regressions, missing index, lock contention EXPLAIN, slow queries
Deploy / Config mismatch between environments, drift, secrets changes diff + rollback test
Abuse / Bots weird patterns, bursty load, scraping loops rate limit + WAF
stability signal performance signal risk signal

The shape I aim for is straightforward: cache what you can at the edge and keep API boundaries clean, making the slow stuff obvious (and measurable). Quite a disciplined separation of concerns.

Users devices / browsers Edge / CDN cache-control / swr compression Frontend Svelte UI static assets API / Backend Node services rate limits PostgreSQL indexes / plans Observability logs • metrics • alerts
Edge does the heavy lifting; backend stays predictable; DB stays indexed; and the whole thing stays debuggable.
Path tracing (interactive)
Toggle a path highlight to see which layer I’m mentally “walking” when I’m debugging.
Browser requests / assets CDN / Edge cache + swr compression API Layer auth / limits services DB indexes
I’m basically trying to answer: “Is it edge? is it compute? is it storage?” then slicing until the root cause is obvious.

If something regresses, I want answers in minutes. That's what determines a smooth user experience. The dashboards I build focus on: route timing (p95/p99), error spikes.

Alerts with signal

Thresholds that matter. No endless spam. If it pages you, it should be real.

Release correlation

Link spikes to deploy windows so you can bisect quickly and roll back cleanly.

Hot-path visibility

Track the routes users actually hit. The “slowest endpoint” list is always on-screen.

Latency & error trend view (layout format) p95 timing (visual format)
Far more than pretty graphics, this is about fast diagnosis: determining what broke (and where), as well as how to address it.
Tail latency simulator
Drag the sliders above (traffic/cache) and watch the (mock) p95/p99 shift. This is the exact way I sanity-check changes: what happens to the tail?
p95
178ms
stable
time → response ms
Error budget pulse
This is the “am I about to ship risk?” gut-check. Canary on + healthy tails? Ship. Canary off + tails spiking? Pause.
Error rate
0.28%
quiet
time → errors %
Ship stance: proceed

The stuff I find myself obsessing over is basically the “production checklist”: making things measurable and reversible on the rare occasions that traffic behaves badly.

Caching discipline

Edge caching + sensible invalidation beats adding more servers nine times out of ten.

Backpressure

Rate limits + sane timeouts prevent one weird pattern from turning into a cascade.

Postmortem habit

If it fails, write it down. The system improves when you treat failures like data.

Quick runbook (how I think during a regression)
identify → isolate → fix
// “Something feels slower” — first 5 moves:
1) Check p95/p99 by route + error rate
2) Correlate with deploy window / config changes
3) Look for DB hot spots (plans, missing indexes, locks)
4) Confirm cache behavior (hit rate, TTLs, headers)
5) If unsure: rollback, then bisect in smaller steps
It’s not glamorous, but it keeps production from turning into a guessing game.
Playbook (the stuff I actually reuse)
This is the reusable “muscle memory” I keep refining: how to spot a regression quickly, how to ship safely, and how to keep performance from drifting over time.
Latency triage

Split by route → compare p95/p99 → look for a single hot path causing the tail.

Change isolation

Diff deploy + config → rollback if needed → bisect in smaller steps until it’s undeniable.

DB sanity check

Scan slow query list → check plan changes → validate indexes against real access patterns.

Cache correctness

Confirm headers (TTL/SWR) → verify hit rate → watch for stampedes under burst.

Abuse containment

Rate limit + validation → isolate endpoints → block obvious automation without collateral damage.

Postmortem loop

Write it down → fix the root → add guardrail → update runbook so it never repeats.

runbook.md (snippet)
# Click “Insert snippet” (UI-only) to drop in a runbook excerpt.
Load Lab (interactive)
A quick sandbox for how I think about performance tradeoffs. Move knobs, see the “story” of the system change.
Concurrency
240
simulated requests in-flight
Payload size
68kb
bundle / response weight
Lab: stable under burst
Throughput + saturation (mock)
time → throughput + saturation
throughput saturation

BetLess

Science-backed recovery platform • behavioral tracking
Recovery-first design Tracking & reflection Calm UI

What is BetLess?

BetLess is a recovery platform built to help people break gambling addiction through reflective habit loops and structured tracking. Ultimately, the goal is clarity (as well as momentum), giving people tools that make it easier to spot their triggers and stay in control of their cravings.

Cover image for Amenhotep IV: The Forgotten King

Amenhotep IV: The Forgotten King

I wrote Amenhotep IV as a five-act Shakespearean tragedy about one of the most controversial pharaohs in Egyptian history. The story imagines Akhenaten’s inner world as he defies tradition and declares a new god, only to descend into isolation.

Read More